Pavex, progress report #4: performance is a feature
An overview of the work done on `pavex`, an upcoming Rust web framework, in May 2023.
👋 Hi!
It's Luca here, the author of "Zero to production in Rust".
This is progress report aboutpavex, a new Rust web framework that I have been working on. It is currently in the early stages of development, working towards its first alpha release.Check out the announcement post to learn more about the vision!
Overview
It's time for another progress report on Pavex, covering the work done in May!
At a glance:
- Pavex has a logo, at last!
- I built
cargo-px, a new tool that simplifies code generation in Pavex projects. It enables automatic regeneration of the server SDK crate, eliminating the need for manual updates. - Multiple rounds of performance optimizations to make sure that code generation doesn't become a bottleneck in your development workflow.
The execution time ofpavex_cliwent from ~3.7s to ~0.9s on our Realworld example, a 4x speedup.
Let's dive in!
You can discuss this update on r/rust.
Table of Contents
- What's new
- What's next?
What's new
Logo
Nothing says "things are getting serious" like a logo. And we finally have one for Pavex!
I was keen on giving the project a visual identity, so I finally bit the bullet and hired a designer for the job. We went through a few different iterations, but I'm quite satisfied with the end result.
A heartfelt thanks to all the people who provided feedback on the early sketches.
Streamlining code-generation: cargo-px
Code generation is a key step in a Pavex project:
- You define the
Blueprintfor your application (routes, constructors, error handlers)
pub fn blueprint() -> Blueprint {
    let mut bp = Blueprint::new();
    bp.constructor(f!(pavex_auth::session_token), Lifecycle::RequestScoped);
    bp.route(GET, "/", f!(crate::home_page));
    // [...]
}
- Pavex's compiler processes the
Blueprint(compile-time dependency injection, yay!) and generates the runtime scaffolding for your application, the server SDK1.
The server SDK is not a stand-alone Rust file. It has dependencies—it must import code from the crates that define the request handlers, constructors and error handlers that you specified in your Blueprint, as well as other crates in the Pavex ecosystem.
It is a full-blown Rust library, that requires its own Cargo.toml file.
You want Pavex to take care of it, automatically, because having to manually update its Cargo.toml every time you change your Blueprint would be an awful experience.
Crate generation != file generation
The Rust ecosystem doesn't have a good story for crate generation.
Build scripts rely on the assumption that you aren't going to modify the manifest of the crate you are building. They also don't allow you to invoke cargo commands2 from within the build script itself, which is a requirement for Pavex's compile-time reflection, since it relies on rustdoc's JSON output.
But build scripts are convenient!
cargo takes care of running them every single time it makes sense to do so. You don't have to think about them.
Having a stand-alone script that you need to invoke manually every time you change your Blueprint makes for a much worse experience. I tried it out for a couple of days, for the sake of science, while working on Pavex's examples: it just doesn't work. You forget to regenerate the server SDK, and you end up with a broken build.
Having exhausted all available options, I built a new tool: cargo-px (cargo Power eXtensions)
It lets you specify a crate generator in the manifest of the soon-to-be-generated crate.
It then transparently invokes the code generator when necessary, assuming you route your commands through cargo-px instead of cargo (i.e. invoke cargo px build rather cargo build).
cargo-px
cargo-px is not tied to Pavex: it is a general-purpose tool that can be leveraged by any Rust project that needs to generate an entire crate rather than a stand-alone self-contained source file, a requirement that is more common than you might think. Check out the announcement blog post for a deep-dive on the problem space and the precise mechanics of cargo-px.
Using cargo-px with Pavex
When it comes to Pavex, the integration with cargo-px works as follows:
- You write a small binary that will act as the code generator (i.e. the build script) for the server SDK, starting from the
Blueprint:use cargo_px_env::generated_pkg_manifest_path; use pavex_cli_client::Client; use api_core::api_blueprint; use std::error::Error; fn main() -> Result<(), Box<dyn Error>> { let generated_dir = generated_pkg_manifest_path()?.parent().unwrap(); Client::new() .generate(api_blueprint(), generated_dir.into()) .execute()?; Ok(()) } - You create the server SDK as an empty library crate via
cargo new --lib api_server_sdk - You add an entry into the
[metadata]section of theCargo.tomlof server SDK, pointing at the code generator:[package.metadata.px.generate] generator_type = "cargo_workspace_binary" # The name of the binary we defined above generator_name = "bp"
That's it!
Every time you invoke cargo px build or cargo px check, cargo-px will invoke the code generator, which will in turn regenerate the server SDK crate if needed.
I have plans to streamline this further with a project scaffolding tool for Pavex, which will take care of setting up the server SDK generator for you.
I've been using cargo-px for a few weeks now when iterating on Pavex's examples, and it has been working great. It just takes a bit of conscious effort to remember to type cargo px [...] instead of cargo [...]; I'll be probably working on a shim soon enough to make it transparent (as an opt-in feature).
Streamlining code-generation: performance
Make it work, make it right, make it fast.
With cargo-px, we covered the first two points.
Let's talk about performance now!
Code generation is Pavex's super power, but it comes at a cost: it adds one more step to your build process.
I firmly believe that a fast feedback loop is essential. It can make or break you productivity, and I don't want Pavex to get in the way.
If the code generator has to be invoked every time you build your project, it needs to be fast.
The goal is to stay under 1 second, the difference between "the machine is working" and "I'm going to check Twitter while I wait". Staying under 300 milliseconds would be even better, but I don't think it's realistic, as you'll see in a moment.
The rest of this section will be a deep-dive into each of the optimisations that I have implemented this month, explaining the rationale behind them and the performance gains that they brought.
If you don't care about the finer details, this is the summary:
| Optimisation Round | Execution time (s) | Speedup vs baseline |
|---|---|---|
| Baseline | 3.677 ± 0.057 | - |
| #1 | 1.701 ± 0.014 | 2.2x |
| #2 | 1.417 ± 0.013 | 2.6x |
| #3 | 1.196 ± 0.006 | 3.1x |
| #4 | 0.928 ± 0.002 | 4.0x |
The methodology
Pavex's Realworld example will be our reference project3. Despite the name, it is just a toy example at the moment: it has a single ping route.
But that's fine: it'll give us a sense of the performance floor of the code generator, the minimum amount of overhead that we expect Pavex to add to our build process.
I'll be using cargo px check as the command to measure, since it is the command that is going to be invoked most often during a development session: a good proxy measure for the speed of the feedback loop.
We will be measuring the execution time of the second+ invocation of cargo px check. The first invocation compiles all the crates in the dependency tree of your project—something that you would have to do anyway even if you had just run cargo check.
All the measurements have been taken on my personal laptop, a MacBook Air (M2, 16GB RAM, Ventura 13.3.1), using hyperfine (hyperfine --warmup 3 'cargo px check').
The baseline
Let's establish a baseline, the starting point of our optimisation journey.
Before I started to focus on performance, cargo px check took 3.677s ± 0.057s on the Realworld example.
That's kind of a lot!
Where is the time being spent?
We can get an understanding of what goes under the book by asking Pavex to give us telemetry data:
PAVEX_DEBUG=true RUST_LOG=trace cargo px check
Pavex will emit tracing logs to stdout as well as saving a Chrome tracing file4 that we can inspect using the Perfetto UI.
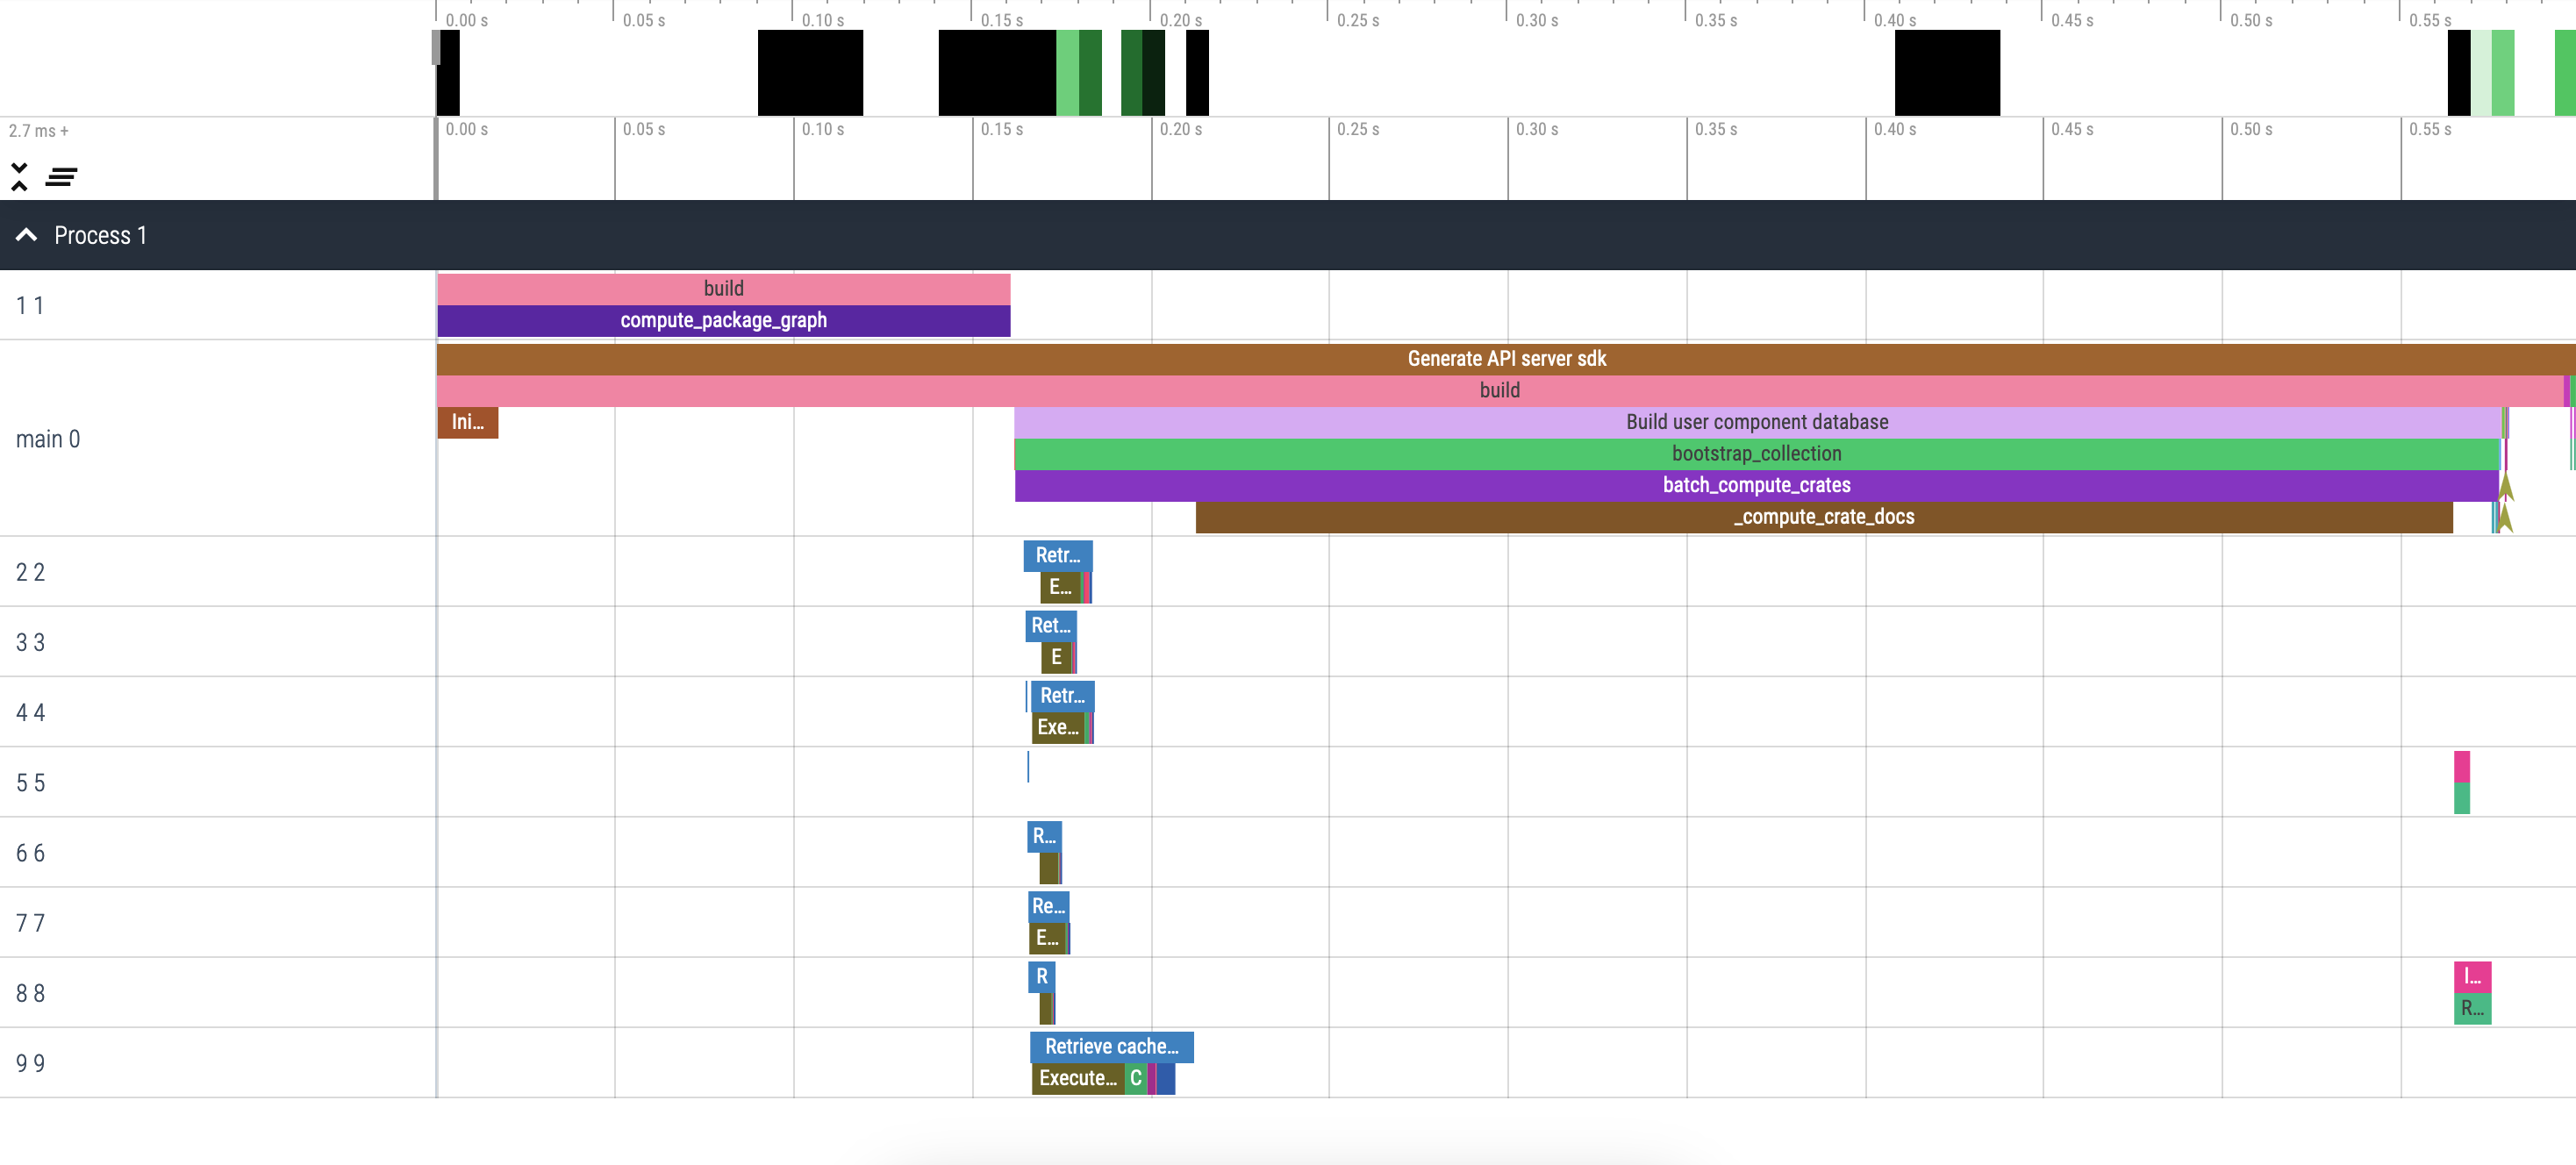
This is what it looks like:
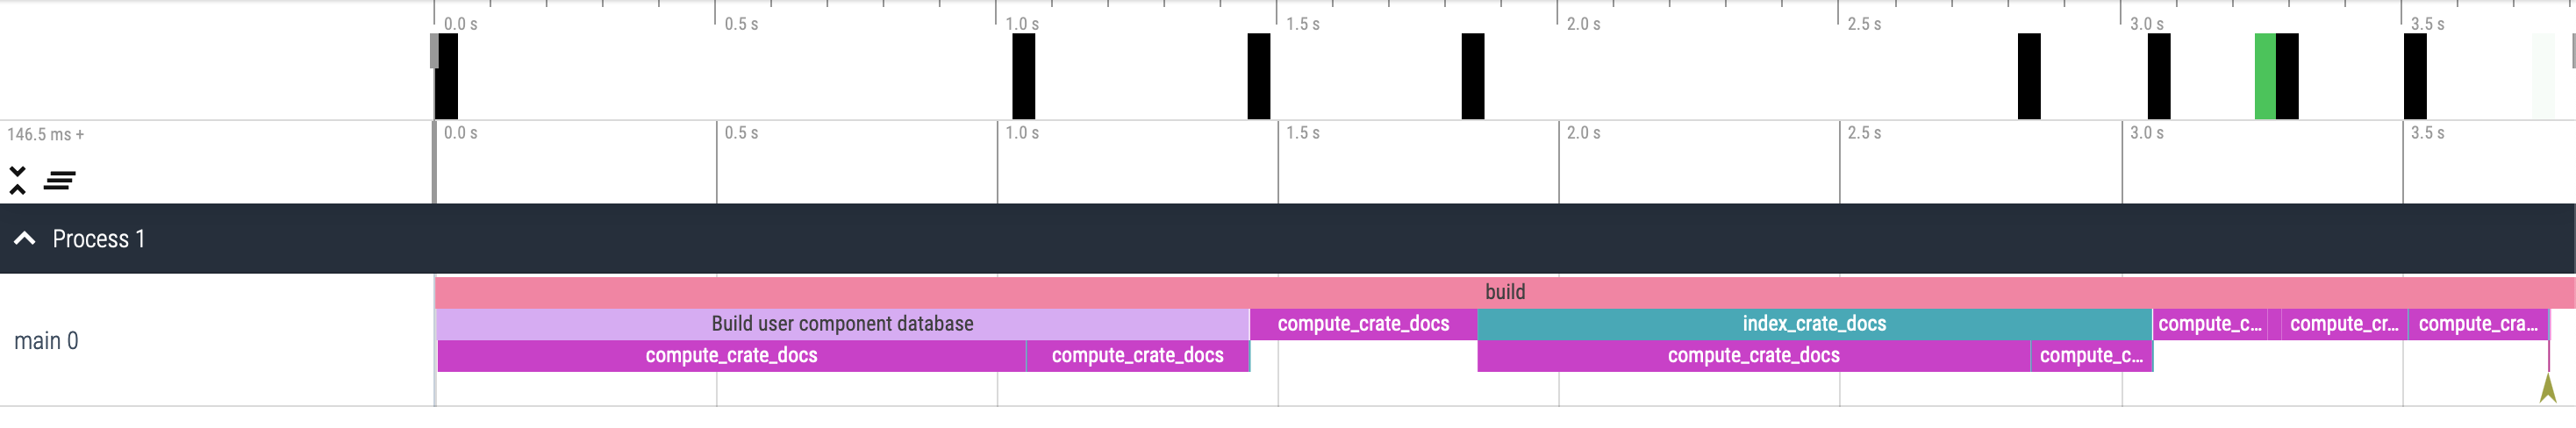
We are spending pretty much all of our time computing the JSON documentation for a variety of crates (the compute_crate_docs spans in the screenshot)—i.e. spawning a cargo rustdoc process for each crate that we need reflection for and waiting for it to complete.
This didn't come as a surprise: I had seen from early measurements that rustdoc's JSON output is unfortunately not as blazingly fast as I'd like it to be.
Optimisation #1: caching 3rd party crates
I went for the most obvious strategy: if something is expensive, cache it5.
I chose SQLite as our on-disk cache. We have a dedicated table to store the documentation of 3rd party crates, using a composite primary key made of their version, the activated features, their source, the specific toolchain used to generated their docs and a few other bits.
After the first invocation of cargo px check, the cache is warm and we can see a significant improvement in the execution time: 1.701s ± 0.014s. That's a 2.2x speedup, not too bad!
We can expect the cache to stay warm as well: we only need to compute new docs if you introduce new dependencies, change the features of existing dependencies or change the toolchain used to generate the documentation.
Can we do better? Let's look at our trace data again:
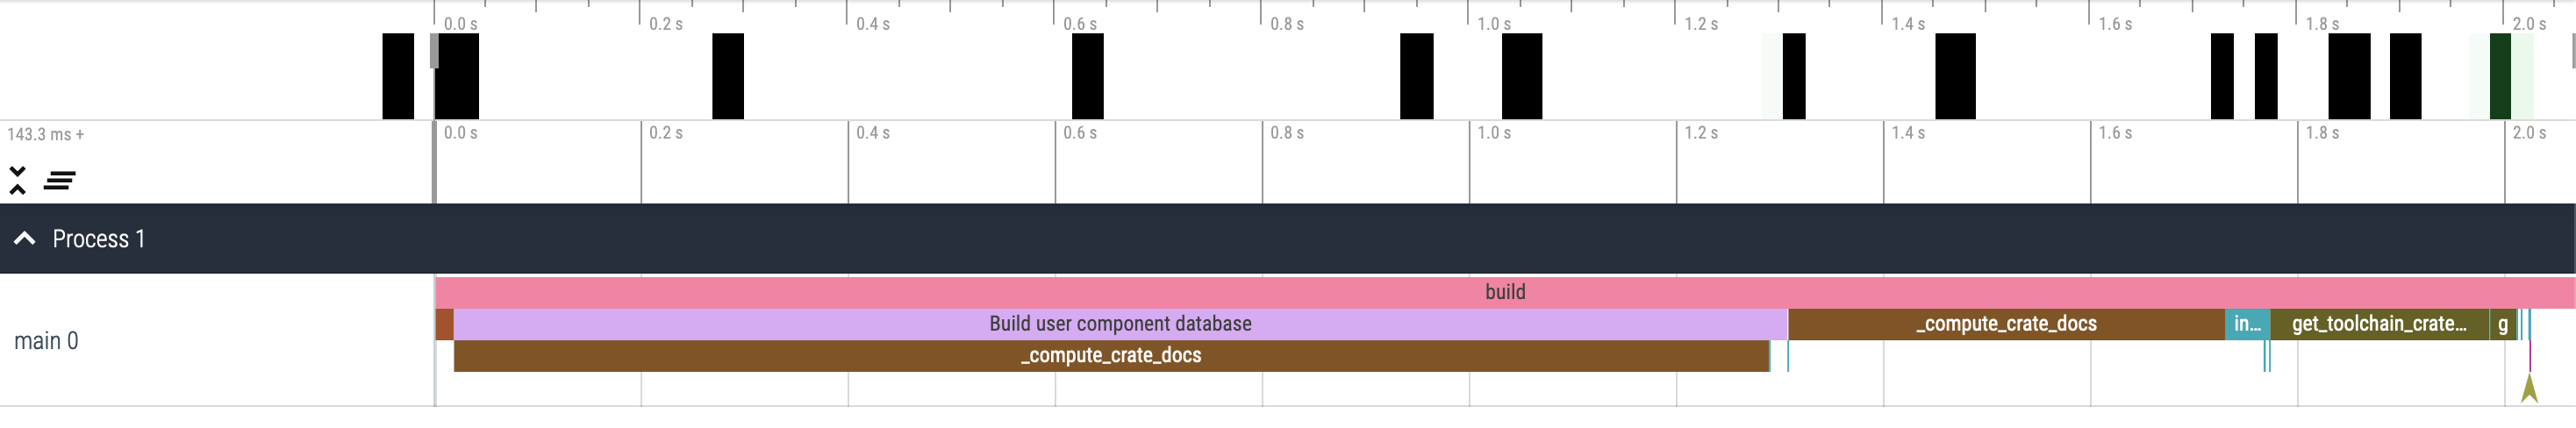
Three spans dominate the execution:
- Computing the crate docs for
conduit_core, the crate that defines theBlueprint; - Computing the crate docs for
pavex_runtime, which comes as a path dependency since we are using a local version of Pavex; - Loading the docs for the toolchain crates (
core,allocandstd), which are precomputed and distributed viarustupin therust-docs-jsoncomponent.
The first two are tricky to cache: we need to find a way to determine if the a local crate has changed in order to correctly invalidate the cache. Tricky problem, I'm not keen on tackling it right now.
The last one is interesting: we are not computing the docs for the toolchain crates, we are just loading them from a file and deserializing them from JSON.
It turns out that the JSON docs for core are pretty big (40MBs) and deserializing them is not cheap: it takes ~127ms in a microbenchmark using serde_json. That hurts.
Optimisation #2: lazy deserialization
Let's look under the cover: what's inside the JSON docs for a crate?
The top-level JSON object looks like this:
pub struct Crate {
    pub root: Id,
    pub crate_version: Option<String>,
    pub includes_private: bool,
    pub index: HashMap<Id, Item>,
    pub paths: HashMap<Id, ItemSummary>,
    pub external_crates: HashMap<u32, ExternalCrate>,
    pub format_version: u32,
}
The biggest field is index: a map that associates a unique identifier to every single item in the crate—functions, structs, enums, trait implementations, implementation blocks, etc.
We never access all items in the index: we only need to access the ones that are relevant to the Blueprint that we are compiling. It turns out, that's a tiny percentage of the total number of items in the index.
Which brings us to optimisation #2: lazy deserialization.
When storing the index in the SQLite cache, we don't serialize it as a HashMap<Id, Item>. We serialize it as a combination of two columns: items and items_id2delimiters.
items is just a byte buffer, a BLOB column: we iterate over the values in index, serialize them and concatenate their serialized representation into a single byte buffer.
items_id2delimiters, instead, is our lookup table: for each Id in the original index HashMap, it stores the offset in the items buffer where the serialized representation of the corresponding Item starts.
When loading the JSON docs for a crate from the cache, we don't perform any deserialization of the items column. We just load the bytes and store them in a Vec<u8>.
When we need to access an item with a certain Id from the index, we use the items_id2delimiters lookup table to determine the offset in the items buffer and then pay the deserialization cost just for that item.
hyperfine confirms our intuition: the execution time of cargo px check is down to 1.417s ± 0.013s, a 1.2x speedup over the previous iteration.
We can also see it in the trace:
The get_toolchain_crate span for core is now gone, and the corresponding retrieval from the SQLite cache takes a lot less (18ms).
Optimisation #3: don't touch the disk if you don't have to
Looking at the trace, I noticed how the time spent inside Pavex's CLI now totals to ~0.7s. At the same time, hyperfine is reporting an execution time of ~1.4s.
Where are the other ~0.7s going?
With the help of samply, I managed to capture a flamegraph of the execution of cargo px check:
We are spending some time at the beginning in cargo-px, primarily to execute cargo metadata. A tax that we pay again at the beginning of the execution of Pavex's CLI.
What's interesting though, is the time spent in cargo again after pavex_cli has finished its execution. Since we are running a benchmark, the generated code is always the same and we should not need to recompile it.
As it turns out, cargo takes into account the last modification time of the source file for local crates when determining if it needs to recompile them. pavex_cli always writes to disk the generated crate, even if it is unchanged, which in turn changes the mtime of the source files and triggers an unnecessary recompilation.
The fix is easy: only write to disk the generated files if they have changed, using a checksum.
hyperfine confirms the win: the execution time of cargo px check is down to 1.196s ± 0.006s, another 1.2x speedup. It's not much, but it's honest work and a very simple change.
Optimisation #4: memoise the list of crates we need
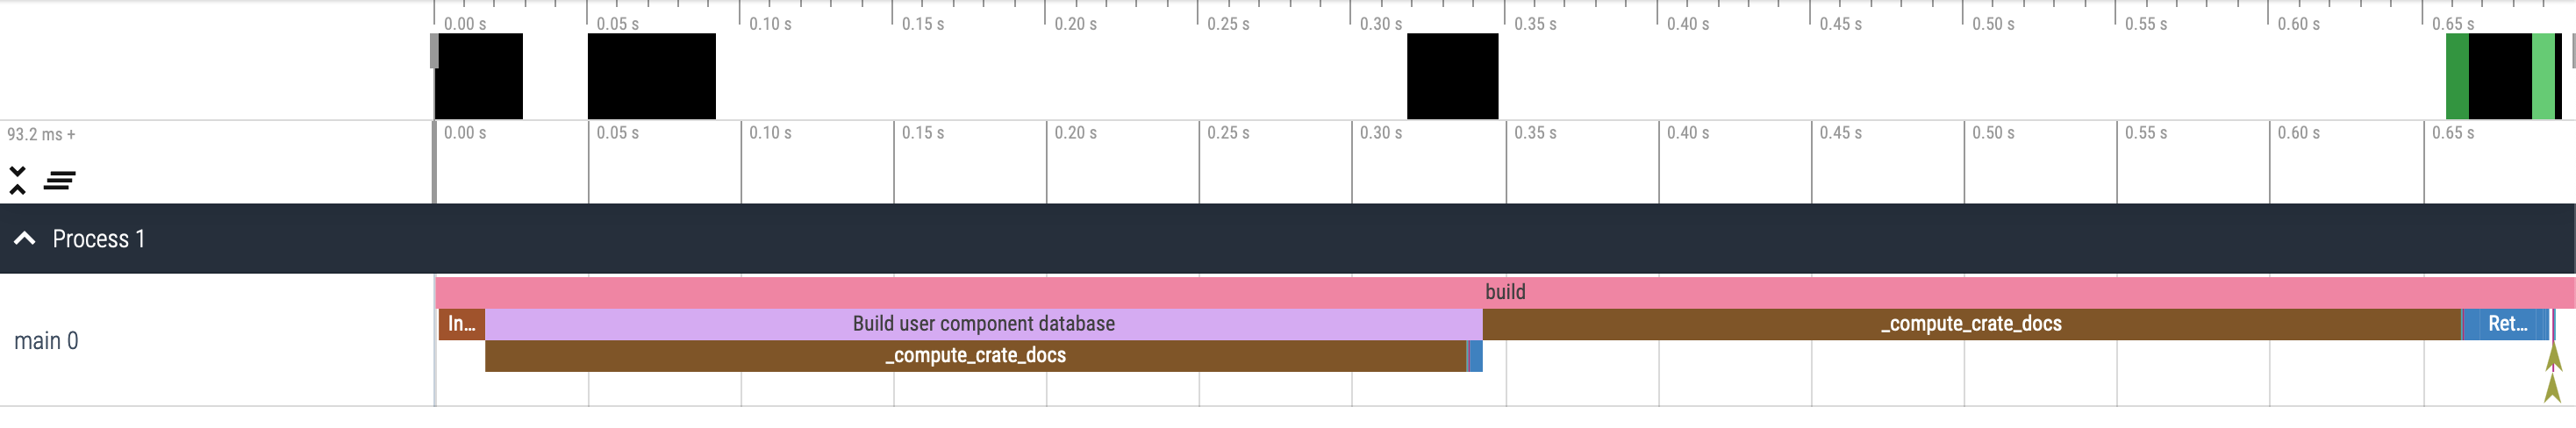
Let's go back to the last trace:
The big issue here is that we need to compute the JSON docs for two different crates (conduit_core and pavex_runtime) and we are doing it serially.
It'd be ideal to do it in parallel, leveraging all the cores of the machine we are running on.
There's two obstacles in our way:
cargo rustdoccannot compute the JSON docs for more than one crate at a time- We need to know the list of crates that we need to compute the JSON docs for ahead of time
The first obstacle can be solved by using cargo doc and the RUSTDOCFLAGS environment variable, as @jyn suggested to me on Zulip.
The second obstacle is much harder to overcome.
Let's look at a request handler as an example:
pub fn blueprint() -> Blueprint {
    let mut bp = Blueprint::new();
    bp.route(GET, "/", f!(my_ui::home_page));
    // [...]
}
When processing the Blueprint for the application, Pavex doesn't know anything about the request handler for GET / apart from its import path, my_ui::home_page.
Based on that path, it knows that it'll need to compute the JSON docs for the my_ui crate.
After having computed its JSON docs, we find out that my_ui::home_page is a function that takes a &hyper::Request:
pub fn home_page(_req: &hyper::Request) -> Result<HomePageResponse, HomePageError> {
    // [...]
}
Now we need to go and compute the JSON docs for hyper as well. But we had no way of knowing that ahead of time!
I spent a few days thinking about complicated solutions to get an approximate list of the crates that will be needed ahead of any expensive analysis, but then it hit me: we have an on-disk cache, we can cheat!
We can store in the cache the list of JSON docs that we needed to access the last time that pavex_cli was invoked for a certain project.
We can then load this list the next time that pavex_cli is invoked and get all those docs in parallel, either by loading them from the cache or by computing them in parallel if needed.
It works like a charm: the execution time goes down to 0.928s ± 0.002s, a further 1.3x speedup over the previous iteration. And we have finally crossed the 1s threshold, which is a nice psychological win.
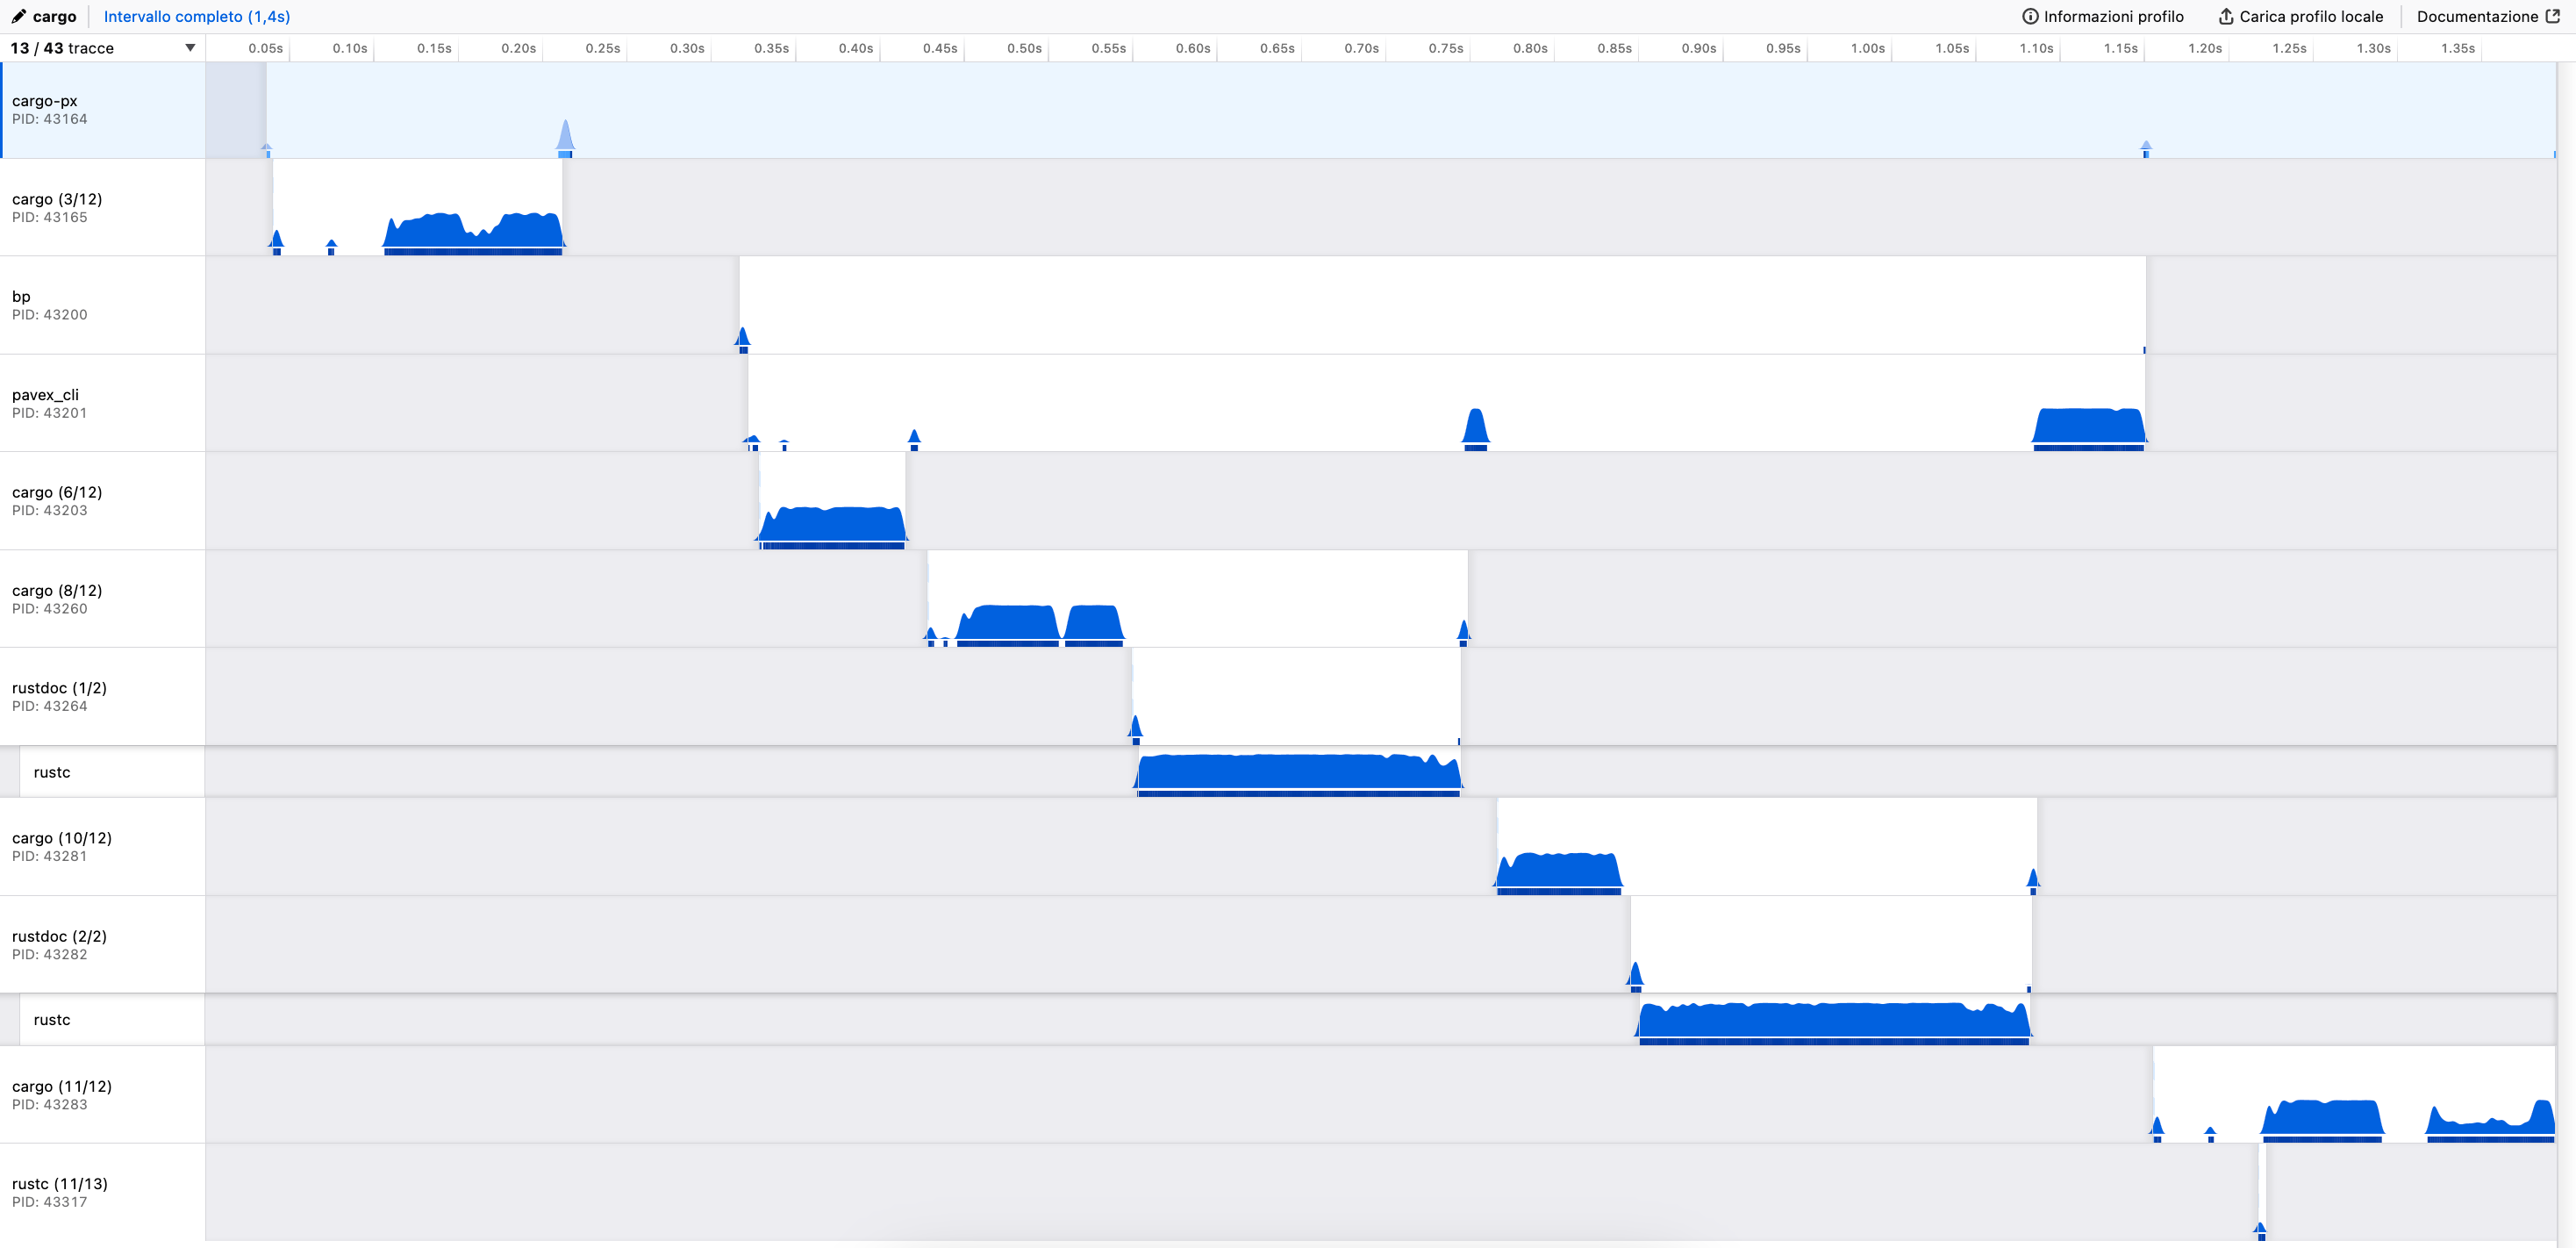
You can see the parallelism at play in the trace:
Seeing all those threads working in parallel makes me happy.
Optimisation #N: more to come
Once you're in the mindset of optimising, it's hard to stop.
Part of the work now is upstream:
- Change the way
rustdoc-typesserializes enums in order to unlock the usage of binary formats (see PR) - Add an
--output-formatflag tocargo rustdocandcargo docin order to fix doc caching incargo(see issue) - ...optimise
cargo metadata? - ...make
rustdocfaster?
I'll be tackling the well-defined problems first, and revisit the open-ended ones later down the line if the need arises.
I'll also have to keep an eye on how Pavex's own algorithms behave when the project size increases. All the measurements we have taken so far have been on a toy example, but I want to make sure that we don't regress when we start to use Pavex on non-toy projects.
What's next?
June is going to be a busy month for me—I'll be moving back to Italy after almost 6 years in the UK. But I'll keep working on Pavex between one box and the other.
The focus will be on fleshing out the Realworld example, trying to cover the entire spec for the backend.
I expect I'll be going back and forth between the example and the framework itself, adding missing features and fixing bugs as I go.
If all goes well, I might get a chance to implement middlewares, the last missing piece of the puzzle before we can start to think about an alpha release. We'll see where I am at the end of June.
See you next month!
You can discuss this update on r/rust.
Subscribe to the newsletter if you don't want to miss the next update!
You can also follow the development ofpavexon GitHub.
I have borrowed the terminology from the smithy-rs project, which I had the pleasure to work on during my time at AWS. It works quite well to describe any system where you are generating a library that encapsulates the structure of your server application from a specification of some kind (a Smithy model, a Blueprint in Pavex, an OpenAPI spec, etc.)
With the exception of the commands that do not need a lock on the target directory, like cargo metadata.
To be able to compare apples to apples, I have manually checked out the various commits along our optmisation journey and made sure that the Realworld example was exactly the same at each step.
Courtesy of the tracing-chrome crate.
To be specific, we need to cache it across invocations; Pavex has had an in-memory cache since the very beginning in order to avoid recomputing the same docs multiple times during a single invocation of cargo px check.